Version 25.5
Released on 21.10.2025
New Features
Improved Unbalanced Power Flow table for Phase Comparison
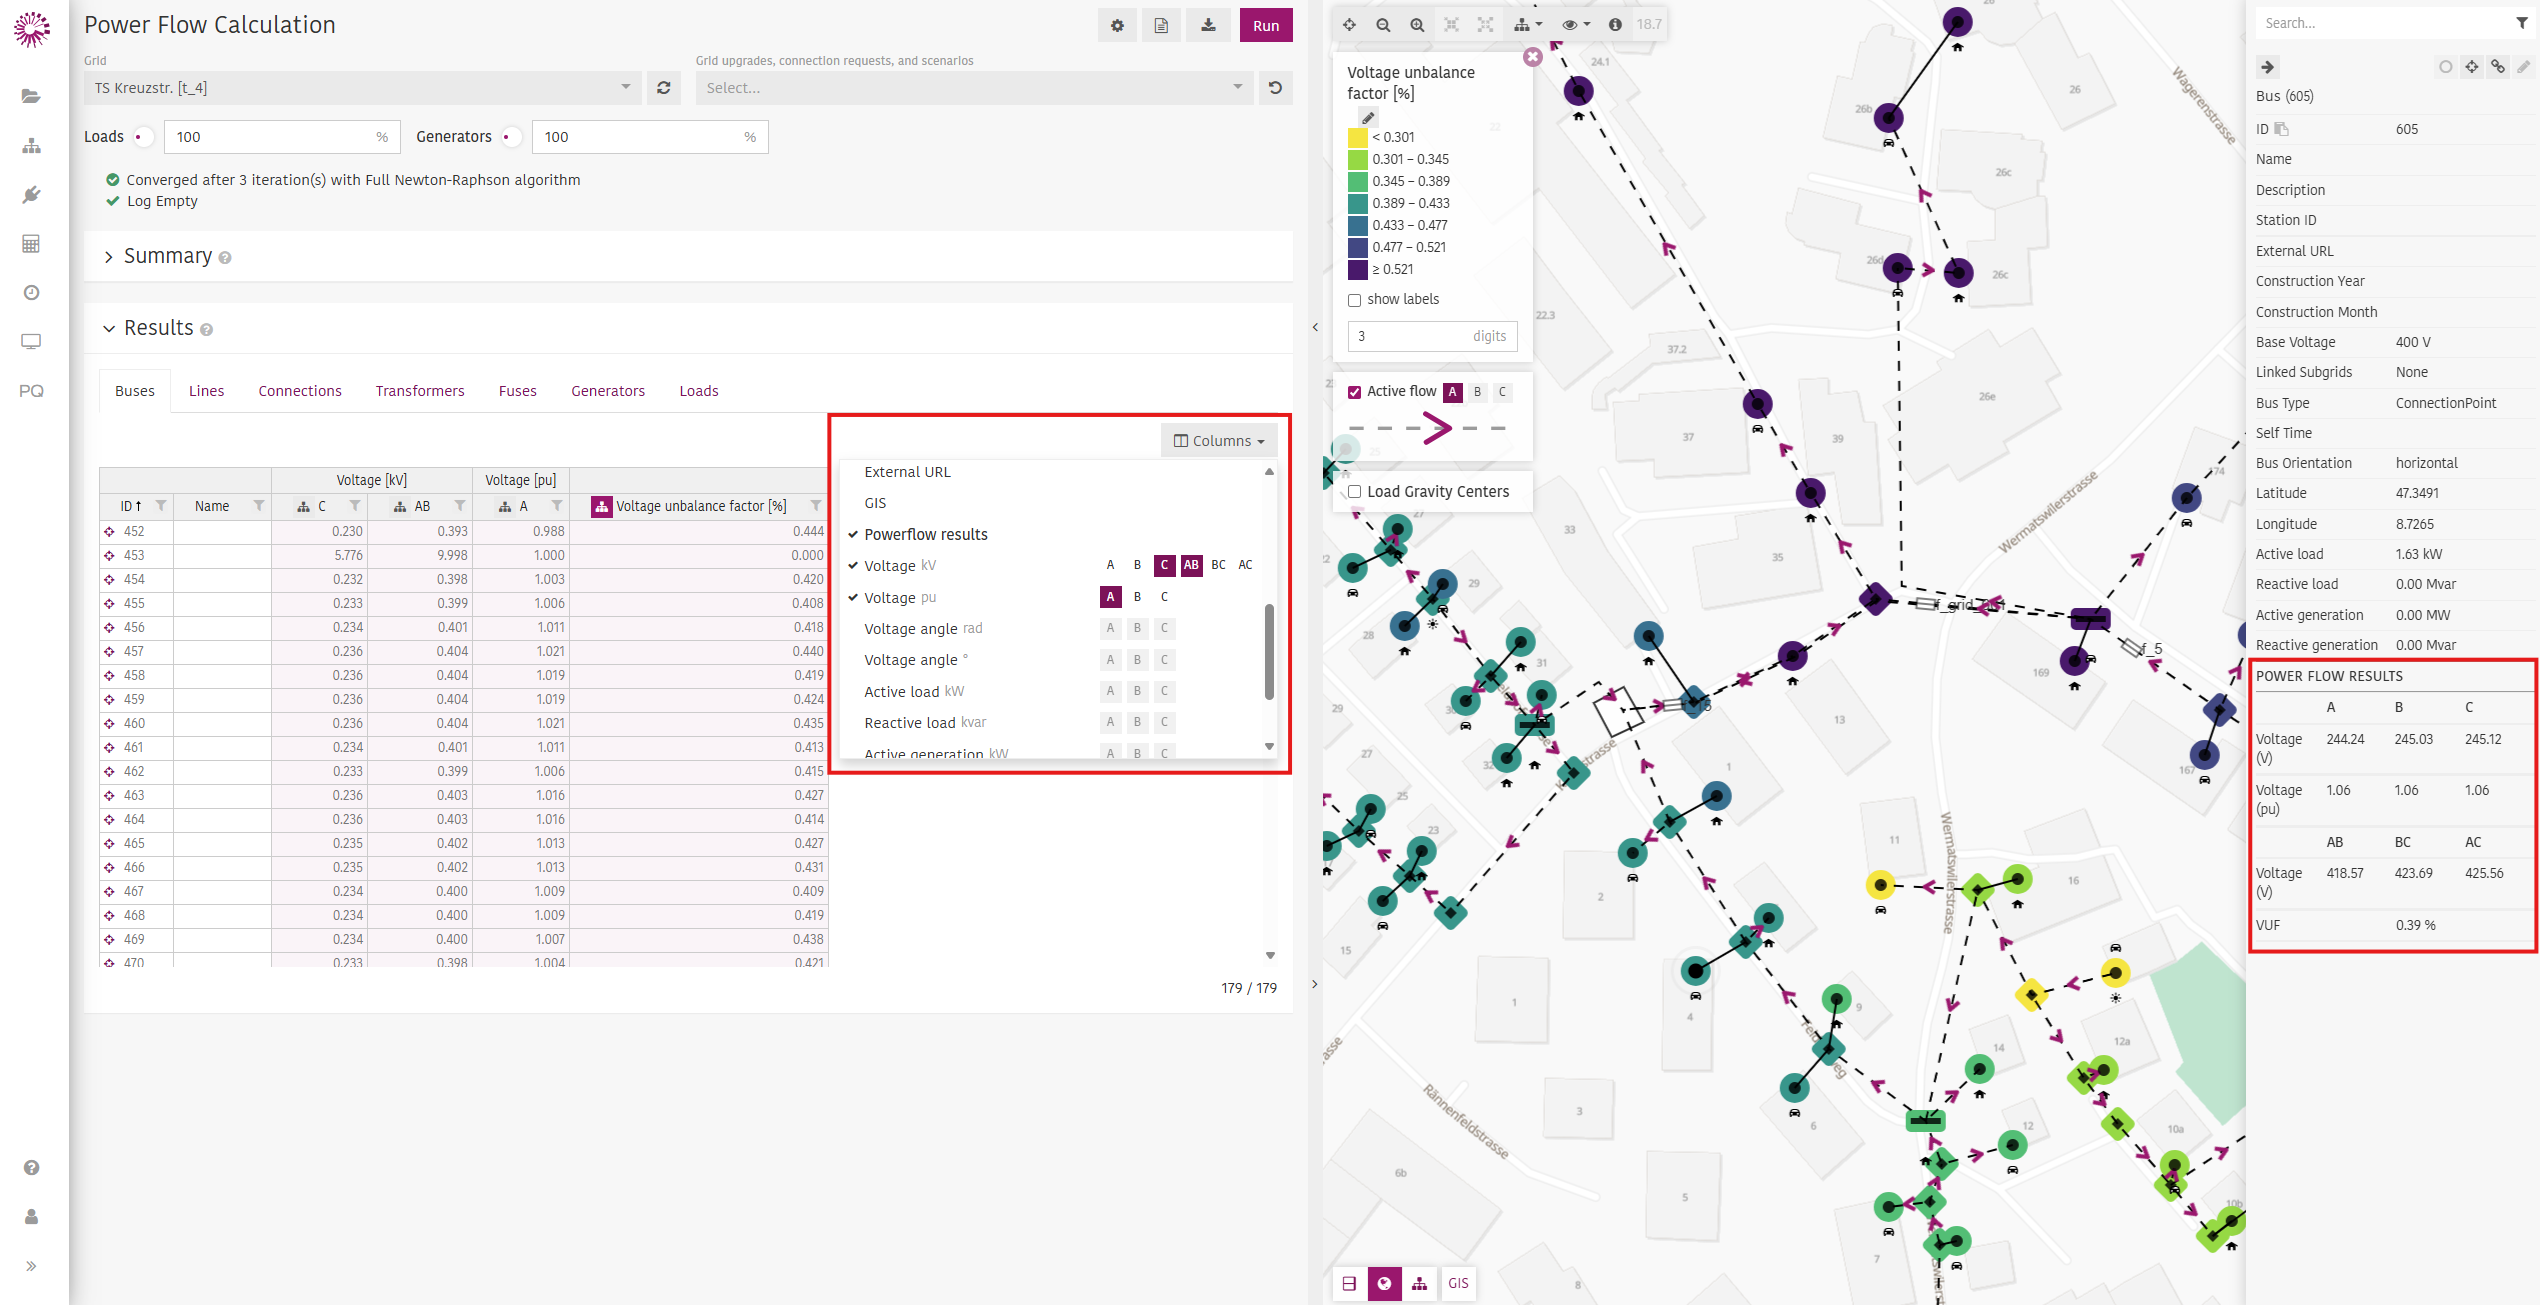
Enhanced the Unbalanced Power Flow table UI to allow easy comparison of results across different phases side by side. Users can easily spot variations in voltage, power, and other key metrics, helping to analyze phase imbalances more clearly.
 |
|---|
| Example view of unbalanced power flow results |
CSV Import with Generator Retention
When importing a customer list containing loads and generators, users can now choose to keep existing generators instead of replacing them. This option is available in the Grid Editor wizard and ensures flexibility for scenarios like grid upgrades or pilot projects using external data sources (e.g., PV potential maps).
 |
|---|
| Example of importing a list of new generators while keeping existing ones |
ESRI Online Integration
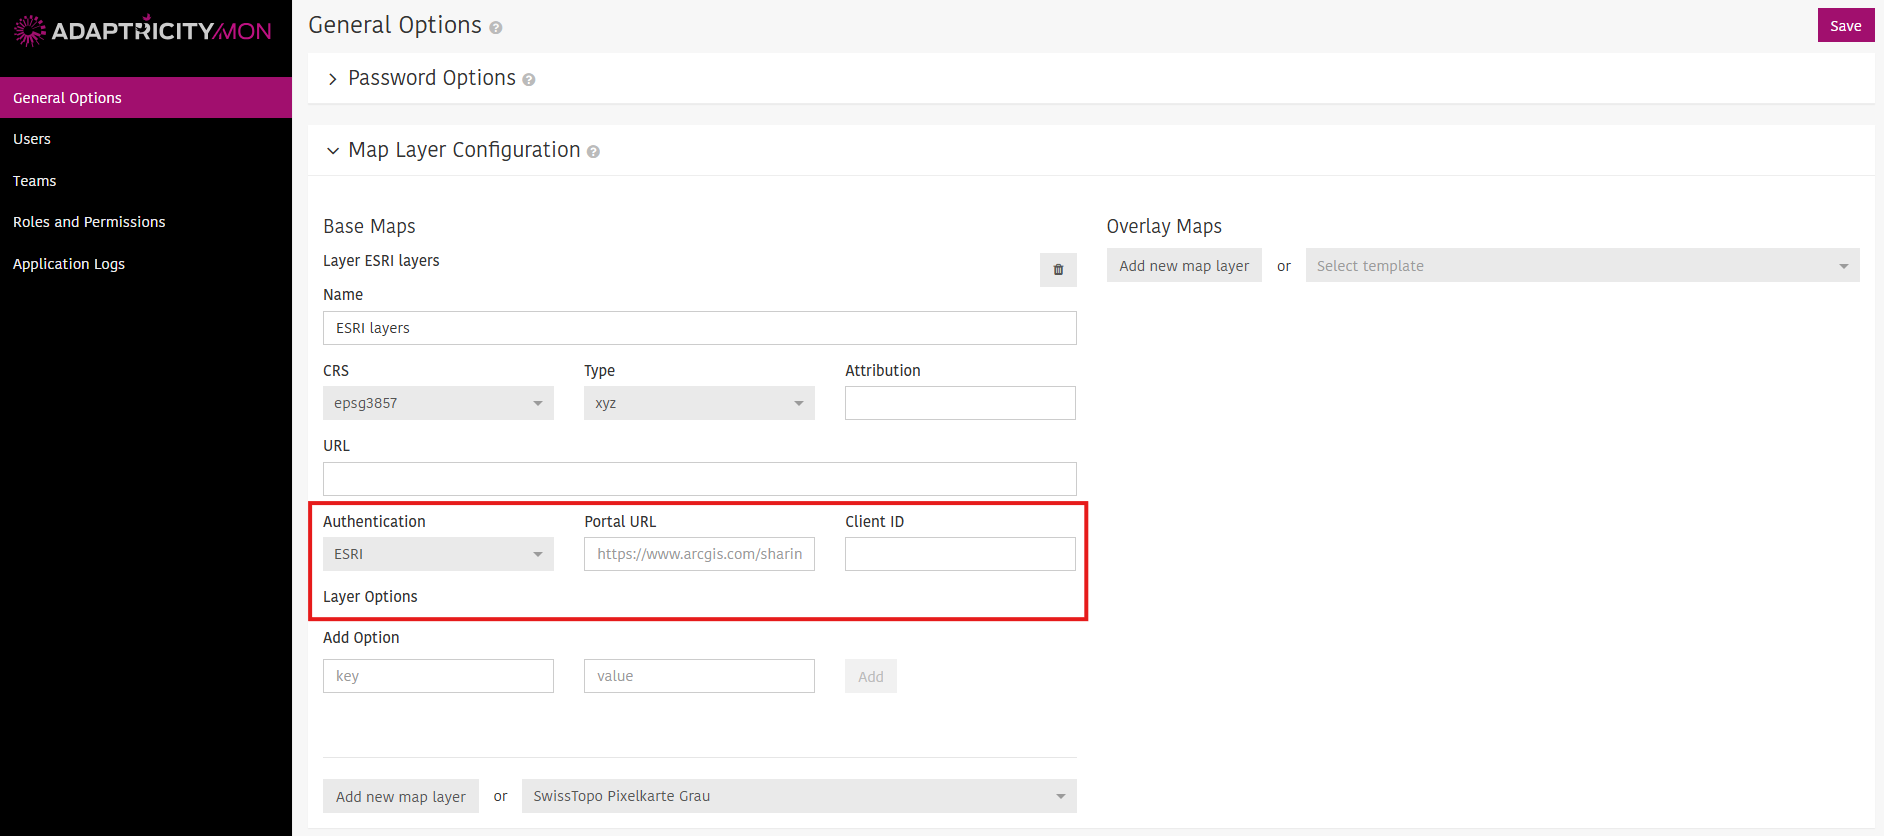
Customers using ESRI as their GIS platform can now log in with their ESRI credentials to access their own map layers. Once authenticated, they can view their ESRI data directly in the platform either as base maps or overlay layers for enhanced visualization.
 |
|---|
| Setup ESRI authentication in Admin Panel |
Dynamic Feeder Loading Limits
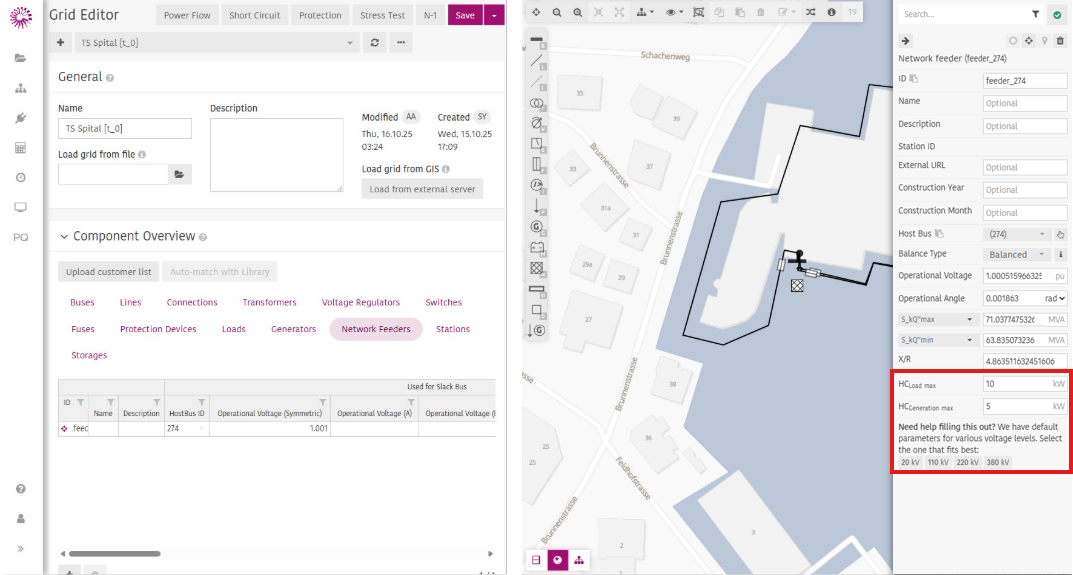
Feeder loading limits for transformers inside stations have been updated to allow setting maximum hosting capacity for generation and load on all lines leaving a substation. This approach applies feeder-based limits, removing the need for higher-voltage network data. The result is more accurate hosting capacity estimates and faster calculations.
 |
|---|
| Example of setting parameters of feeder load values |
Expanded Power flow simulation Results
Users can now see current (A) and apparent power (S) alongside active and reactive power in the load tab for both static power flow and time-series simulations. This makes it easier to understand current patterns and overall power behavior in grid analysis.
 |
|---|
| Example of expanded Power Flow Results |
Multi-Result Hosting Capacity Evaluation
Introduced the ability to evaluate multiple Hosting Capacity results in a single consolidated table for easier comparison.
 |
|---|
| Example of saving and comparing multiple Hosting Capacity results |
Improvements
- N-1 Analysis Enhancements: Added tabs for lines, connections, and transformers on the N-1 page. Violations overview is now included in the N-1 report.
- Power Flow Warnings: A warning is displayed when running a power flow with disconnected loads or generators.
- External Powerflow API Upgrade: The API now supports replacing existing loads and generators for better flexibility.
- Performance Boost for Newton-Raphson: Improved Newton-Raphson power flow performance, which also accelerates hosting capacity calculations.
- Time Series Download Optimization: Introduced multi-layer parallelism with separate grid and meter concurrency settings to significantly improve time series download speed.
- Project Overview .Mon Tab Improvements: Enhanced performance and added more warning/violation details. The tab now uses the new search/list functionality for faster loading of thousands of entries (e.g., connection requests).
- Reactive Power Selection Upgrade: Reimplemented selection logic to allow choosing “Capacitive” or “Inductive” everywhere in the platform. In pages like the grid editor, you can now set reactive power type along with power factor (cos φ).
- Hosting Capacity Iteration Logic: In the first iteration, the system calculates the contribution factor. If it exceeds a defined threshold and triggers a violation, the process stops immediately and sets the capacity to 0 kW. The contribution factor calculation has also been refined for greater accuracy.
- Spanish Ruleset Update: Maximum power rules now apply to buses of any voltage level (previously limited to certain ranges).
- Phase Identification Overview: Added a progress overview for phase identification on the Project Overview page.
- Minimum Power Limit Handling: Instead of restricting power below the minimum limit, the system now logs it under specific conditions (e.g., bus has a stationID, station type is “SUBSTATION,” and request meets defined criteria).
Bugfixes
See full list
Grid
- Fixed API behavior to allow importing customers with zero-valued power; loads without annual energy now correctly set active power to 0.
- Fixed an issue where stations appeared empty on the Project Overview page.
- Fixed a 404 error when clicking the cross-hair icon of a transformer moved during grid reconfiguration; routing and history now update properly.
- Fixed table visibility when reopening the History panel.
- Fixed overlapping line ends when they weren’t connected to a bus.
- Fixed incorrect “A newer version exists” message when editing grid elements after a grid upgrade status change.
- Fixed polygon shape drawing issues in the grid editor.
- Fixed interaction problems with elements inside stations when smart meters were present.
- Fixed component overview table not updating correctly.
- Fixed errors when creating load situations for asymmetric grids; phase-wise feeder now works on unbalanced grids.
- Fixed schematic visualization issues by notifying users when grid element coordinates are missing.
- Fixed initial page load glitch where date inputs briefly showed validation borders and warning bars before timestamps loaded.
- Fixed visibility of grid links inside stations in split view; links no longer appear outside the station.
- Fixed repeated label merging when resetting the color legend.
- Fixed result display limit on Power Flow page; increased limit and added warnings when results exceed it.
- Fixed alert color legend highlighting.
- Fixed inflate/deflate behavior so only elements within the current station are scaled; non-station elements remain unaffected.
- Fixed errors occurring during project deletion.
- Fixed issues preventing load situations from being copied properly to other projects.
Static Calculations
- Fixed missing rated current in SST fuse results; added current column and corrected base voltage values for buses.
- Fixed transformer loading limit information by adding an info message in calculation settings.
- Fixed header button removal from fuse columns in Power Flow.
- Fixed print preview of static calculation reports by reducing extra spacing.
- Fixed extra elements appearing in the grid when arranging with segment merging enabled.
- Fixed run permission for team admins in Hosting Capacity; team admins can now run calculations.
- Fixed Excel export for asymmetric grids to include Total Power [kW].
- Fixed incorrect violation data highlighting in reports.
- Fixed missing Alerts legend on Grid Scalng Stress Test page.
- Fixed short circuit calculation to show reasons when inconsistent grids fail.
- Fixed load and generator creation for unbalanced grids, phase-wise generation now displays correctly.
- Fixed ability to search add-on elements on map view in project pages.
- Fixed ability to change load and generator types on project view pages.
- Fixed scenario names visibility across all pages with scenario dropdowns.
- Fixed duplicate grid layer drawing in schematic view.
- Fixed Total Power [kW] result coloring in grid visualization.
- Fixed hosting capacity calculation stalling at 94% when “Limit voltage change at bus bars” rule is enabled.
- Fixed deletion of incomplete results when a calculation is canceled.
- Fixed auto-run calculation logic to start when bus count is below defined limit.
Fixed text truncation for long scenario names when no result is available.
Fixed poor performance on Short Circuit Calculation page when entering stations.
- Fixed mismatch between Power Flow results in grid inspector and result table.
- Fixed short circuit feature for unbalanced grids.
- Fixed cancelability and progress reporting for Stress Test calculations, Cancel button now works correctly.
- Fixed Hosting Capacity Spain ruleset to respect “Evaluation scope”, moved setting into International Options for clarity.
- Fixed color legend editor to allow adding new buckets, corrected insertion logic.
- Fixed phase-to-phase voltage magnitude consistency when changing vector group.
- Fixed scheduled Hosting Capacity and Power Quality updates not executing.
- Fixed outdated grids from appearing on maps and calculation pages; result tables no longer show elements without results.
- Fixed chart behavior when all phases are deselected; phase selection buttons now work in fullscreen mode.
- Fixed incorrect values displayed in P(smart meter) chart for input meter data.
Connection Request
- Fixed translation issues on the DACHCZ page; applied corrections to all affected translated text.
- Fixed handling of grids with loops in Connection Request evaluation results to ensure proper graph rendering.
Monitoring
- Fixed residual load calculation in the load profile chart on the .Mon page.
- Fixed incorrect units in histogram plots for load, generation, and losses on .Sim and .Mon; scaling now matches line plots.
- Fixed popup shrink issue by optimizing placement and styles; default placement set to auto bottom-left.
- Fixed monitoring update logic to prevent multiple full re-imports from running simultaneously.
- Fixed missing tooltips for toolbar buttons on .Sim and .Mon dashboards.
Timeseries Simulation
- Fixed result fetching for grid variable plots (buses, lines, transformers) on the simulation page.
- Fixed report generation navigation; clicking “Report Generation” now opens the correct .Sim module page instead of redirecting to Projects.
- Fixed error when loading quantile plot reports on the .Sim page.
- Fixed alert-range tooltip cutoff when hovering grid bars in Hierarchical simulation results.
- Fixed truncation and resampling of three-phase timeseries data; internal errors no longer occur when selecting time spans with no available data.