Project Home
The Projects Home page is the central page in Adaptricity. It provides quick access to the list of all grids, grid upgrades, connection requests and more.
TIP
Clicking on the Adaptricity logo in the top left from any page always returns the user back to the Project Home page.
Overview
The interface is divided into three main sections:
- Toolbar: An expandable bar on the left side of the screen with quick access to all features.
- Left Panel: Displays a scrollable list of grids, grid upgrades, connection requests, depending on the selected tab.
- Right Panel: Shows an interactive map of the grid layout, centered on the region of interest.
Access the Project Settings by clicking on at the top of the page.
Toolbar
The toolbar provides quick access to all features of Adaptricity and additional settings:
- Projects
- Grids
- Connection Requests
- Static Calculations
- Time-Series Simulations
- Monitoring
- PQ Power Quality
- Change system language
- Contact Adaptricity support (also directly available through support.adaptricity.com)
- Access the Help page (docs.adaptricity.com)
- Change Team
- User settings
- Access the admin panel
- View information about the product
- Access API documentation
- User profile settings
- Developer settings (only accessible by super-admins)
- Logout
The toolbar can be expanded or minimized on the lower left of the screen.
Grids

This tab lists all grids present in this project.
The grids are searchable by Name and can be ordered by Name or by Last Updated.
- Name: The name given to the grid. If the grids are automatically updated through GDI, the grid name corresponds to the name of the transformer in the grid. If a grid is fed by multiple transformers, the grid name is the concatenation of the names of each tranformer, separated by a +.
- Last Updated: Timestamp corresponding to the last modification of the grid.
Filtering
Grids can be filtered by Outdated or Inconsistent after clicking on the show filter icon .
Searching
Any grid elements or addresses can be searched from the Search... input field on the top right of the window.
Grid elements can be searched by the following attributes:
- ID
- Name
To search for grid elements click on Search for ID, Name... after writing the search term. A list of grid elements maching the search will appear. Clicking on an element will zoom the map to that element and open the details panel on the right.
To search for addresses, click on Search for address... after writing the address. A list of addresses will appear that are closest to the center of the visible map.
Upgrades

This tab lists all grid upgrades belonging to the project. It provides a quick overview of the upgrades throughout all the grids.
The upgrades are searchable by Name (either the name of the upgrade or the name of the grid they belong to) and Status.
The upgrades can be sorted by several columns:
- Time: Timestamp when the upgrade was created.
- Name: Name given to the upgrade.
- Grid Operator Cost: Estimated cost of the upgrade for the grid operator.
- Customer Cost: Estimated cost of the upgrade for the customer.
- Total Cost: Total cost of the upgrade.
- Status: Current status.
Connection Requests

This tab lists all connection requests belonging to the project.
The connection requests are searchable by Name (either the name of the connection request or the grid they belong to), Type, Power, Assignee or Status.
The connection requests can be sorted by several columns:
- Time: Timestamp when the connection request was created.
- Name: Name given to the connection request (e.g.,
New pump,VDE-AR-N Solar 🌞). - Type: Type of load or generation (e.g., PV, Other load, Combined heat and power).
- Power: Requested capacity in kW.
- Assignee: Assigned person to review the connection request.
- Status: Current status (e.g., Pending, Approved, Cancelled, Built)
TIP
The search supports searching by multiple keywords in one go. For example, searching for PV 57, returns the connection request VDE-AR-N Solar 🌞 from the screenshot above.
.Mon
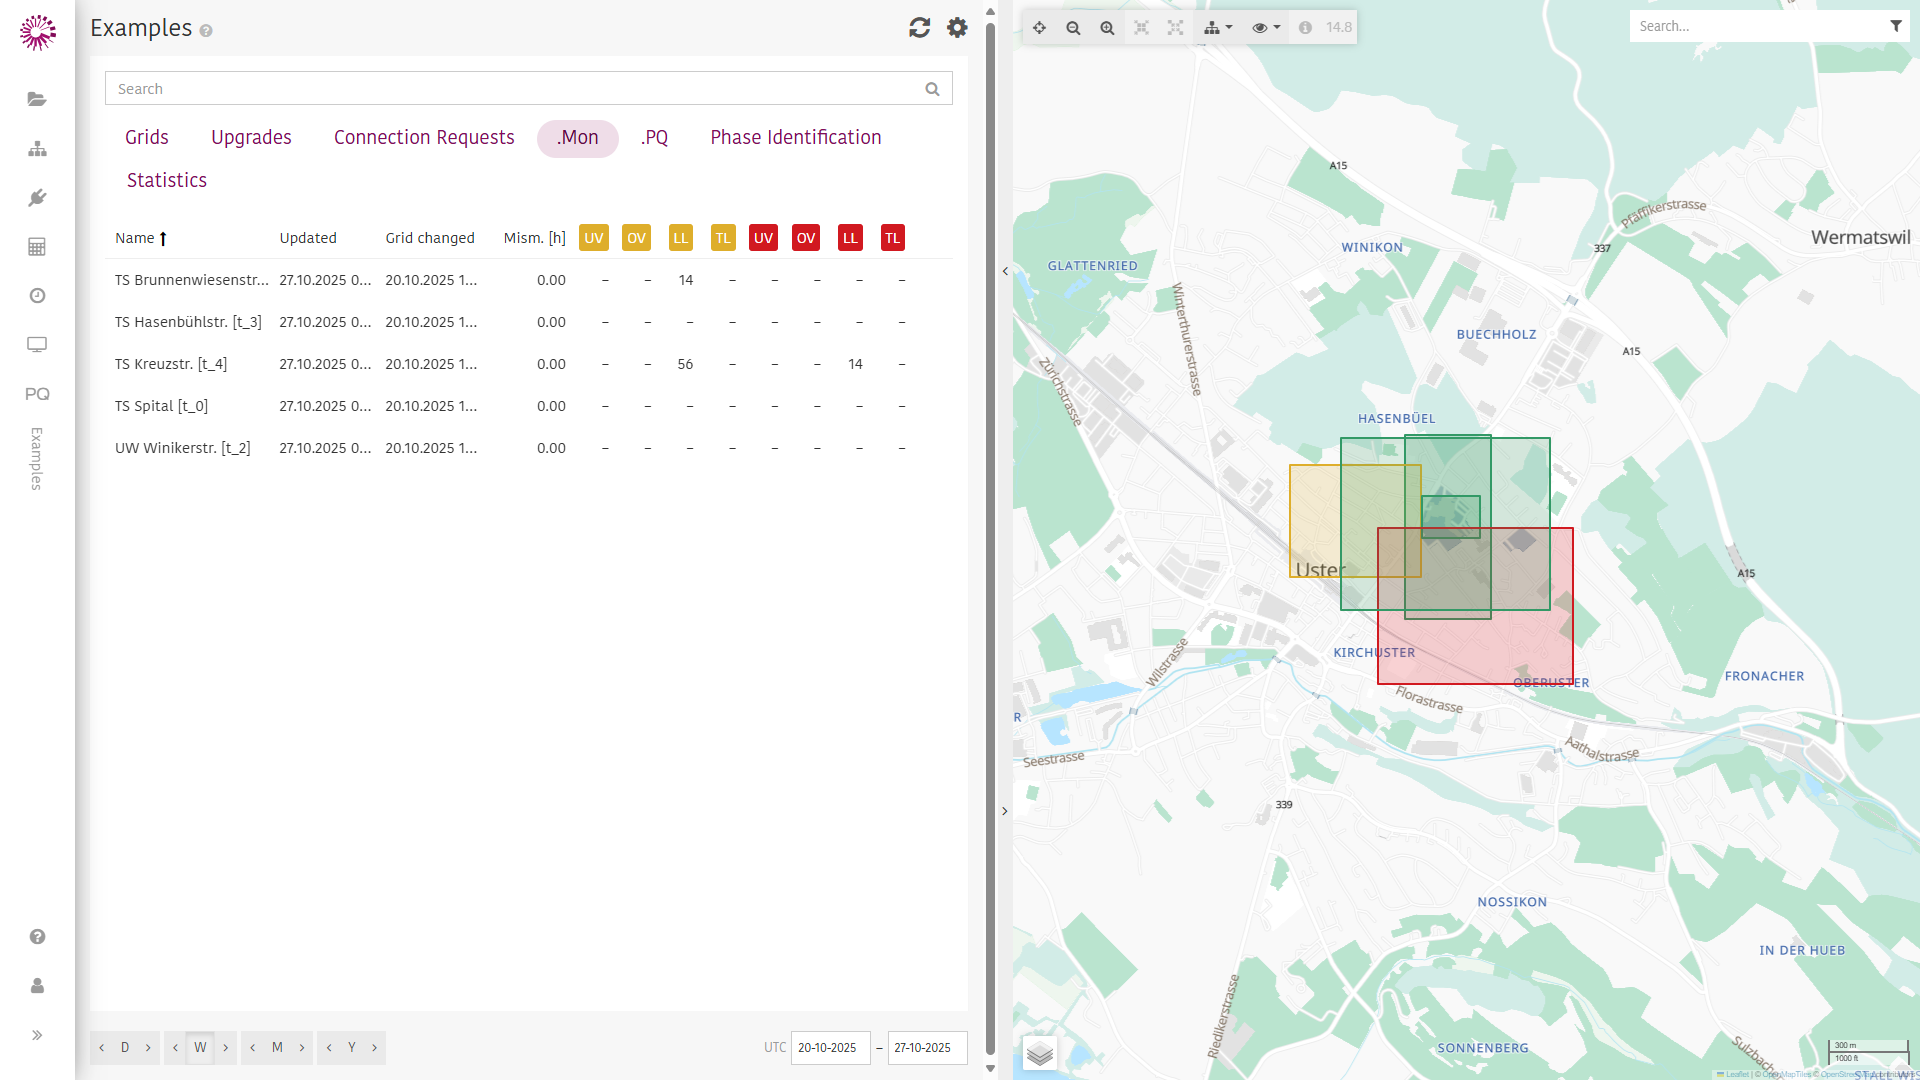
This tab lists all grids for which Monitoring results are available.
The list provides a quick overview of several key statistics over the selected time horizon, which can be specified at the bottom of the page.
Statistics:
Quickly see for how many time steps in the specified time horizon there is a warning or violation for:
- Bus undervoltage (UV)
- Bus overvoltage (OV)
- Line loading (LL)
- Transformer loading (TL)
The operational limits for warnings and violations are defined in the .Mon dashboard.
Additional columns:
- Name: The name of the grid.
- Updated: Timestamp of the latest monitoring update.
- Grid Changed: Timestamp of the last grid modification.
- Mismatch [h]: Number of hours with a mismatch between measured power at the slack bus and simulated power at the slack bus.
.PQ

Power Quality (PQ) projects analyze voltage stability, harmonics, and other quality metrics. This tab helps identify and quantify mismatches in voltage behavior over time.
Features:
- Voltage level classification
- Hourly mismatch tracking
- Visual indicators for severity (e.g., yellow and red zones)
Table Columns:
- Name: Identifier of the PQ analysis (e.g.,
.PQ Example) - Voltage Level: Classification of the grid segment (e.g., Low Voltage)
- Mismatch [h]: Number of hours with detected mismatches, color-coded by severity
- Name: Identifier of the PQ analysis (e.g.,
Statistics

The Statistics tab provides visual summaries and analytical insights into grid-connected devices over time. It helps users understand trends in device deployment and composition.
- Features:
- Fully customizable allowing to add your own analyses
- Device type breakdowns
- Year-over-year comparisons
- Interactive charts for analysis